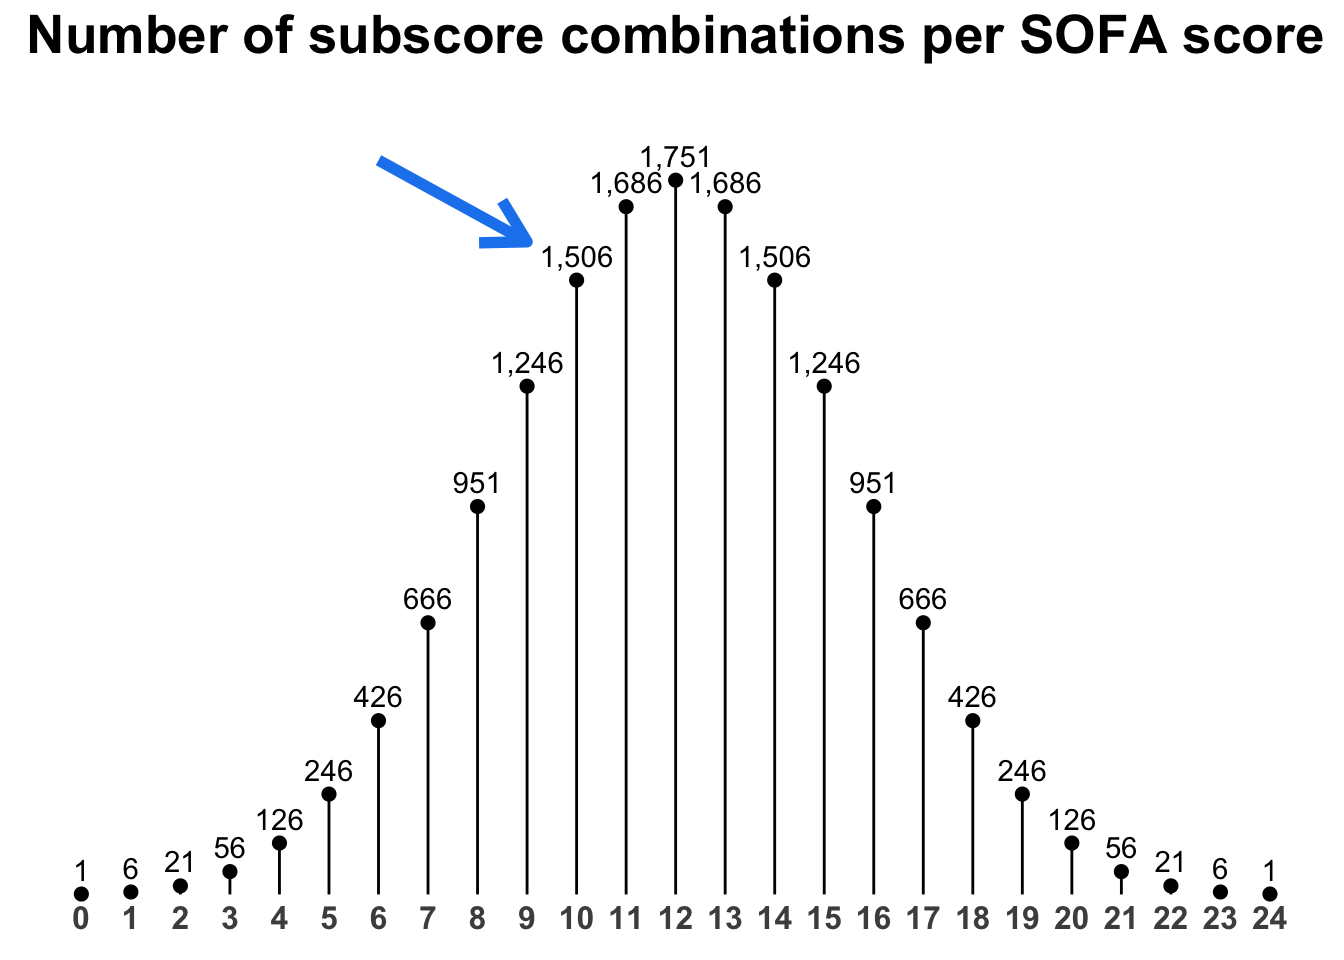
How many ways are there to get a SOFA Score of 10?

programming
Author

Katherine Hoffman

Published

February 10, 2022

The Serial Organ Failure Assessment (SOFA) is a measure used in hospitals to define and assign severity of illness in acutely ill patients. The score measures general dysfunction in six vital organ systems: the lung, brain, heart, liver, kidney, and blood. Each of these organs receive an integer subscore, ranging from 0 to 4, using routinely collected labs and vital signs. The sum of the six subscores, ranging from 0 to 24, creates a patient’s SOFA score. The higher a patient’s SOFA score, the sicker they are. There are plenty of online calculators for SOFA scores that you can check out you’re curious about exactly what goes into each of the subscores.

SOFA scores are useful as a quick live-check for physicians of a patient’s overall well-being, but they’re moreso used extensively in critical care observational research. We use SOFA scores to adjust for severity of illness as a confounder in observational studies, and they’re often used as inclusion criteria for deciding which patients are eligible for therapies in a Randomized Control Trial (RCT). There are plenty of pros and cons of SOFA, but one aspect of SOFA scores that is perhaps non-intuitive for many physicians is just how many ways there are for a patient with a drastically different clinical profile to have the same SOFA score as another patient.

Recently a pulmonologist who I work closely with, Dr. Edward Schenck, sent me an email with the subject line “Help!!” I clicked on his email, and found an interesting question:

There is only one way for a patient to have a SOFA score of 0 (all six subscores are 0). There are six ways a patient could have a SOFA score of 6 (one of the six subscores is 1). But how many ways are there for a patient to get a SOFA score of 10?

It was a serious question from him, but a beautiful mid-day brainteaser break for me. What are the number of possible combinations to get every possible SOFA score, from 0 to 24?

We can solve this problem with only a few lines of code in R by using expand.grid() to make all the combinations of the 6 scores, which can take values 0, 1, 2, 3, or 4.

combos <- expand.grid("lung" = 0:4, "liver" = 0:4, "heart" = 0:4, "blood" = 0:4, "brain" = 0:4, "kidney" = 0:4)
head(combos,n=20)
   lung liver heart blood brain kidney
1     0     0     0     0     0      0
2     1     0     0     0     0      0
3     2     0     0     0     0      0
4     3     0     0     0     0      0
5     4     0     0     0     0      0
6     0     1     0     0     0      0
7     1     1     0     0     0      0
8     2     1     0     0     0      0
9     3     1     0     0     0      0
10    4     1     0     0     0      0
11    0     2     0     0     0      0
12    1     2     0     0     0      0
13    2     2     0     0     0      0
14    3     2     0     0     0      0
15    4     2     0     0     0      0
16    0     3     0     0     0      0
17    1     3     0     0     0      0
18    2     3     0     0     0      0
19    3     3     0     0     0      0
20    4     3     0     0     0      0
combos$total_sofa <- rowSums(combos)
head(combos,n=20)
   lung liver heart blood brain kidney total_sofa
1     0     0     0     0     0      0          0
2     1     0     0     0     0      0          1
3     2     0     0     0     0      0          2
4     3     0     0     0     0      0          3
5     4     0     0     0     0      0          4
6     0     1     0     0     0      0          1
7     1     1     0     0     0      0          2
8     2     1     0     0     0      0          3
9     3     1     0     0     0      0          4
10    4     1     0     0     0      0          5
11    0     2     0     0     0      0          2
12    1     2     0     0     0      0          3
13    2     2     0     0     0      0          4
14    3     2     0     0     0      0          5
15    4     2     0     0     0      0          6
16    0     3     0     0     0      0          3
17    1     3     0     0     0      0          4
18    2     3     0     0     0      0          5
19    3     3     0     0     0      0          6
20    4     3     0     0     0      0          7
sofa_counts <- table(combos$total_sofa)
sofa_counts

   0    1    2    3    4    5    6    7    8    9   10   11   12   13   14   15 
   1    6   21   56  126  246  426  666  951 1246 1506 1686 1751 1686 1506 1246 
  16   17   18   19   20   21   22   23   24 
 951  666  426  246  126   56   21    6    1 

We can plot those numbers using ggplot2:

library(tidyverse)

combos %>%
  count(total_sofa) %>%
  ggplot(aes(total_sofa, n, label=formatC(n, format="d", big.mark=","))) +
  geom_point(size=2) +
  geom_segment(aes(x=total_sofa, xend=total_sofa, y=0, yend=n)) +
  geom_text(nudge_y = 60) +
  labs(x="Total SOFA Score", y="Number of Combinations") +
  scale_y_continuous(expand=c(0,0), limits=c(-20,2000), labels=scales::comma_format()) +
  scale_x_continuous(breaks = 0:24) +
  guides(fill=F) +
  scale_fill_gradient(low="navy",high="firebrick2") +
  theme_classic() +
  theme(axis.line = element_blank(),
        axis.title.y = element_blank(),
        axis.text.y = element_blank(),
        axis.ticks = element_blank(),
        axis.title.x = element_blank(),
         plot.title = element_text(hjust = 0.5,
                                  face = "bold", size = 20),
        axis.text.x = element_text(size=12, face="bold", vjust=2.5)
        ) +
  labs(title="Number of subscore combinations per SOFA score") + 
  annotate("segment", x = 6, xend = 9, y = 1800, yend = 1600, colour = "dodgerblue2", size=2, arrow=arrow())